Point and Figure overview of SPX
Long term trend: Although I do have a potential lower target in mind, I will wait for some confirmation before disclosing it.
Intermediate trend: Maximum 2170 this phase. Larger drop into mid-year after relief rallies.
Important cycles followed
I follow only a few cycles that I consider reliablein my analysis. This is complemented by the analysis of Erik Hadik (www.insiidetrack.com).
The 80-d cycle is due on 4/8-6/8; 40-wk 7/14; 4.5-yr or 9-yr ~7/14.
Market Analysis (Charts courtesy of QCharts)
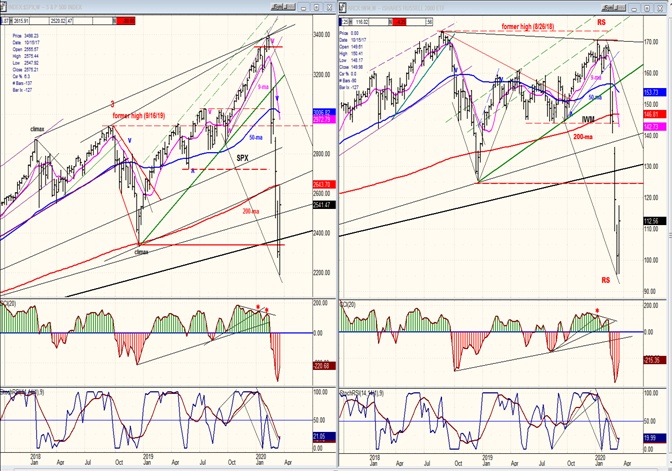
SPX-IWM weekly charts:
The first countertrend rally took SPX to its 200-DMA where it was repelled. IWM did not fare nearly as well and remains with considerable relative weakness to the SPX. There may be some additional trading within the range established this week, with the next short-term low due ~4/8. An intermediate low is not due until mid-year.
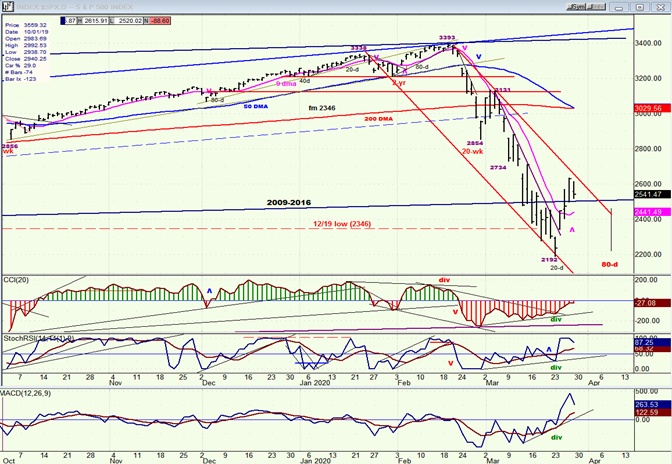
SPX daily chart
Last Monday SPX made a low at 2192 (which was about 200 points below its trend line from the 3/’09 low) and by Thursday had retraced the entired width of its current bearish channel, or 445 points to 2637 before pulling back to 2520 by Friday’s close. The low coincided precisely with a 20-day(hurst) cycle which provided a price lift exarcebated by a deeply oversold market and the passage of a 2 trillion dollarrelief bill.
Extreme volatility continues to dominate trading activity, which causes the 10X P&F chart to look like a 1X chart, creating counts ten times what they would normally be. We’ll need confirmation that a short-term top has already been established so that we can gauge whether or not a new low will be made when the 80-daycycle (also known as the 45-td cycle) bottoms around 4/8. If we do not make a new low, and perhaps even if we do, we could/should make a new recovery high before the next 80-day cycle low which is on ~6/8. Between the two 80-day cycles, there will be shorter (20-day) cycles making their lows.
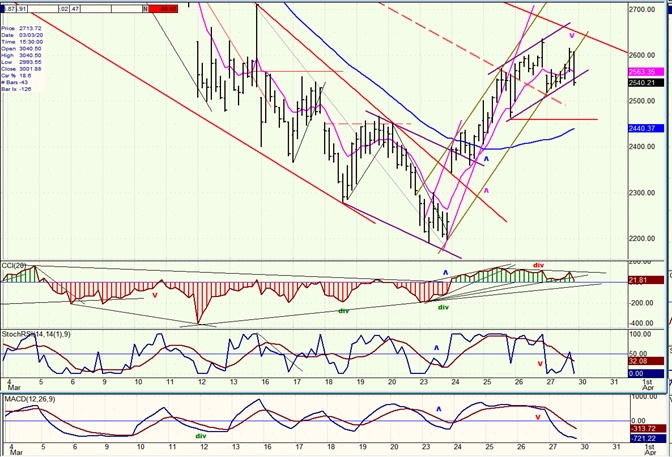
SPX hourly chart
You will note that in spite of the divergence which showed at the top of the rally, and the significant two-phase retracement which has occurred since, the CCI still has not given a confirmed sell signal which requires that it goes negative. With the downside momentum established at the last moment on Friday, odds favor a continuation of the short-term downtrend on Monday to the next support level at the red horizontal line. If we do not get a sell signal, it could mean that the rally is not over. A good count only projected to 2500 from the base, and we had to dip into unreliable weak count for the rest of the rally which, by those standards, projected to about 2663, in concurrence with the 50% retracement level. So, unless we get a confirmed sell signal, that level could still be attained before we get a short-term top.
The hourly chart displayed here focuseson the late stages of the decline and last week’s rally. It’snot easy to conceptualize that this rally represents almost 500 SPX points,and I do not expect current volatility to subside. Friday’s last half hour decline into the close consisted of nearly 70 points! We might as well get used to this “new normal”. It’s likely to be with us for a while.
We should expect at least a 50% retracement of the rally into the next cycle low, to just above 2400. I will come up with something more specific after the topping process has been completed.
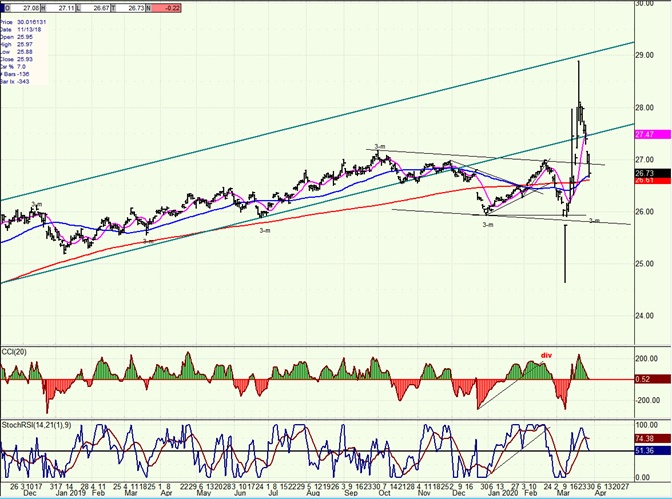
UUP (dollar ETF)
UUP has been very volatile as well, because of the recent actions undertaken by the Fed. The dollar P&F chart shows that it has most likely reached its projection high at 102and that the retracement to 99 is probably the beginning of a corrective decline which could eventually be significant.
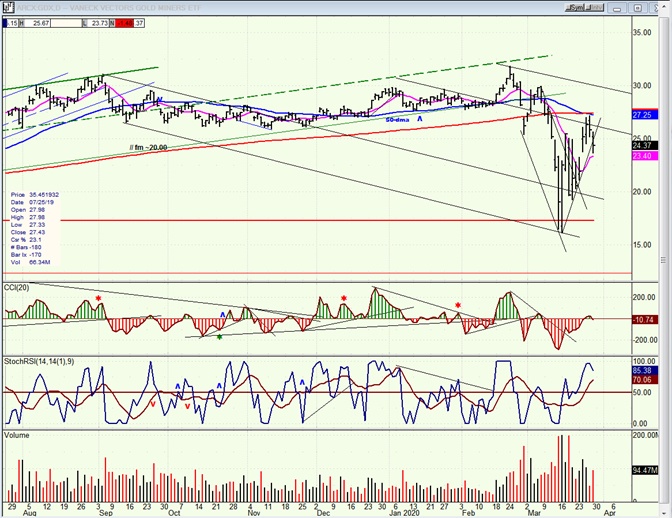
GDX (gold miners)
GDX was not left behind in the volatility contest. It was cut in half from its late February high of 32 down to 16, but had recovered to 27 by last Thursday, closing the week at 24.37. It has already built a base on the P&F chart which should allow it to approximately double in price after it has finished its current correction.
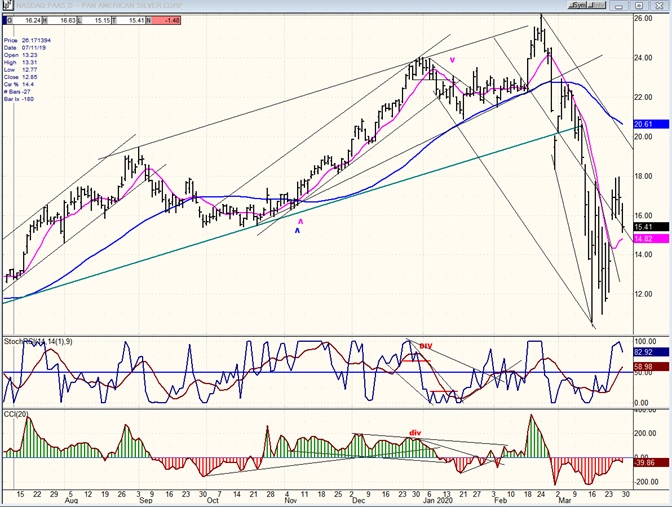
PAAS (Pan American Silver Corp)
Silver is lagging behind gold, but PAASis also forming a nice base -- a small version of the GDX base --which should allow it to reach its former recent high of 26 quickly when it resumes its uptrend.
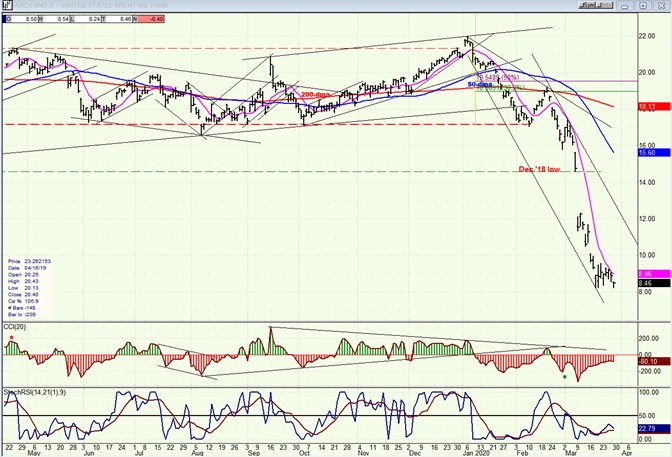
BNO (U.S. Brent Oil fund)
BNO is dead in the water, and may remain that way for some time. Its main preoccupation will be to form a base over the next few weeks and months.
Summary
“A minor cycle low coming next week could lead to another quick spike, but we will have to wait until the second week in April for something more important to develop.”
You can see by last week’s summary that I had not expected that much of a rally. If we do not make a new low into the 80-day cycle, the odds will favor a new recovery high after it has bottomed.
"cycle" - Google News
March 30, 2020 at 07:00AM
https://ift.tt/2UvE6bz
Next cycle low ~4/7 - FXStreet
"cycle" - Google News
https://ift.tt/32MWqxP
Shoes Man Tutorial
Pos News Update
Meme Update
Korean Entertainment News
Japan News Update
Bagikan Berita Ini


Related Posts :
 Barnegat Mayor Novak Out This Cycle on CD-3 Race - TAPinto.net
- Upper-End Limitations of a Duty Cycle - Electronic Design
- From Cycle Couriers to Fruit Sellers: Hungary's Workers Adapt to COVID-19 Crisis - Voice of America
- Three Tips to Beat Insomnia: Breaking the Cycle - Thrive Global
- Cycle trading: The status of the daily equity cycle - FXStreet
0 Response to "Next cycle low ~4/7 - FXStreet"
Post a Comment